1/5
A. Longitudinally Extensive Transverse Myelitis (LETM). Sagittal T2 MRI of the cervical spine shows extensive cord signal abnormality.
B. Sagittal T1 postgadolinium MRI of the spine shows patchy enhancement.
C. Axial T2 MRI of the cervical and thoracic spine shows abnormal signal intensity located centrally in the spinal cord as is characteristic in NMOSD.
D. Sagittal T2 MRI of the thoracic spine shows extensive cord signal abnormality.
E. Sagittal T2 MRI of the thoracic spine shows extensive cord signal abnormality.

2/5
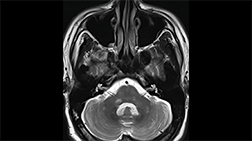
A. Area Postrema Syndrome From Dorsal Medullary Lesion. Axial brain MRI (A) show T2 hyperintense lesion in the dorsal medulla.
B. Area Postrema Syndrome From Dorsal Medullary Lesion. Axial fluid-attenuated inversion recovery (FLAIR) MRI show T2 hyperintense lesion in the dorsal medulla.
C. Area Postrema Syndrome From Dorsal Medullary Lesion. Axial T1-post gadolinium MRI shows enhancement of the dorsal medullary lesion.

3/5
A. Longitudinally extensive T2 hyperintense spinal cord lesion in neuromyelitis optica spectrum disorder (NMOSD).
B. Longitudinally extensive enhancing optic nerve lesion in neuromyelitis optica spectrum disorder (NMOSD)

4/5
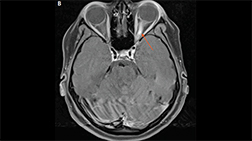
A. Axial fluid-attenuated inversion recovery (FLAIR) MRI of a patient with AQP4+ NMOSD and area postrema syndrome demonstrating T2 hyperintensity in the dorsal medulla (image courtesy of Dr. Divyanshu Dubey).
B. Axial FLAIR MRI from a patient with AQP4+ NMOSD demonstrating an “arch bridge” lesion in the splenium of the corpus callosum (arrow; Image courtesy of Dr. Carlos Sollero).
C. Coronal T1 postgadolinium MRI in a patient with AQP4+ NMOSD demonstrating an enhancing linear brainstem lesion in the right cerebral peduncle.
D. Sagittal FLAIR MRI from a patient with AQP4+ NMOSD demonstrating a marbled lesion in the corpus callosum following the ependymal lining (arrow).
E. Cervical spine sagittal STIR MRI of a patient with AQP4+ NMOSD with longitudinally extensive myelitis.
F. Cervical spine sagittal STIR MRI of a patient with AQP4+ NMOSD with longitudinally extensive myelitis including an area of contrast enhancement on T1 MRI post-gadolinium.

5/5
A. Axial T1 fat-saturated post-gadolinium MRI in a patient with AQP4+ NMOSD demonstrates bilateral optic neuritis over more than 50% of the optic nerves (arrows).
B. Optical coherence tomography taken 1 year after bilateral optic neuritis demonstrates thinning of the right and left retinal nerve fiber layers (right 62 μm, left 54 μm; normal thickness on OCT is more than 80 μm; OCT images contributed by Dr. Sara Qureshi).